|
Lesson Recommendation I am always on the lookout for science lessons that incorporate art in a novel way. Recently, I found a Science Friday lesson that encourages students to create original artwork that uses the line from an actual scientific graph. My seventh graders loved this activity! Each student selected and analyzed a graph related to an environmental issue they cared about. Many chose global climate change, while others focused on overfishing, endangered animals, deforestation, and others. Students were challenged to reflect on the causes or implications of their issue and to illustrate them in their artwork. To accompany their illustrated graphs, each student wrote an Artist Statement describing the significance of the original graph and why they made their artistic choices. They also included a link and citation of the original graph. The lesson, written by educator collaborator Ryan Becker, is available on Science Friday's website. Below are some great examples of student work. Can you spot the line graphs? Student Work 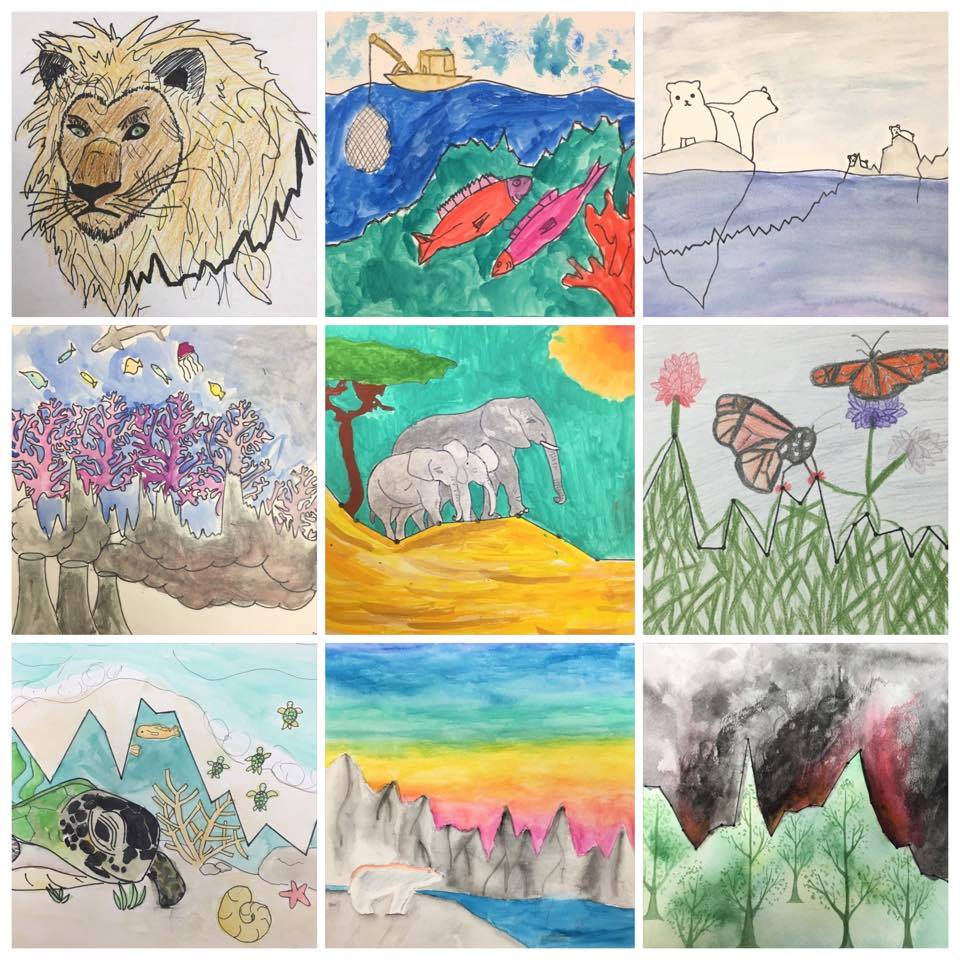 A gallery of some beautiful illustrated graphs created by my seventh graders. A gallery of some beautiful illustrated graphs created by my seventh graders.
|
AuthorThis blog contains occasional dispatches from my science classroom and professional learning experiences. Thank you for reading! 
Archives
December 2021
|
 RSS Feed